The pie chart (i) given below shows percentage distribution of total people (male + female) visited five different clubs and pie chart (ii) shows perc...
Question
The pie chart (i) given below shows percentage distribution of total people (male + female) visited five different clubs and pie chart (ii) shows percentage distribution of total male visited in these five clubs. Read the data carefully and answer the questions given below.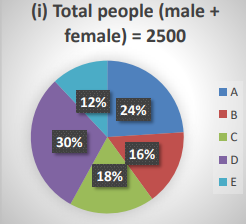
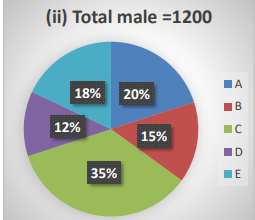
If the price of each visit pass for club A, B, and E is Rs 150, Rs 200, and Rs 250 respectively, find the total revenue (in Rs) generated by all the males who visited these clubs.