The bar graph given below shows the amount (in’000) of tax paid by three different people. Read the data carefully and answer the questions. If Apurv ...
Question
The bar graph given below shows the amount (in’000) of tax paid by three different people. Read the data carefully and answer the questions. 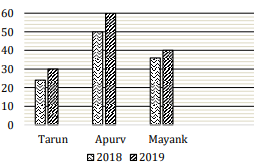
If Apurv paid income tax and GST in 2019 in the ratio of respectively, find the sum of the income tax paid by Apurv in 2019 and the total tax paid by Tarun in 2018 (all amounts are in Rs.).