The bar graph given below shows the amount (in’000) of tax paid by three different people. Read the data carefully and answer the questions. What is t...
Question
The bar graph given below shows the amount (in’000) of tax paid by three different people. Read the data carefully and answer the questions. 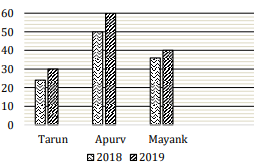
What is the approximate percentage by which the total tax paid by Tarun in both years is more or less than the total tax paid by Mayank in both years?
Calculate: