The bar graph given below shows the amount (in’000) of tax paid by three different people. Read the data carefully and answer the questions. Question:...
Question
The bar graph given below shows the amount (in’000) of tax paid by three different people. Read the data carefully and answer the questions. 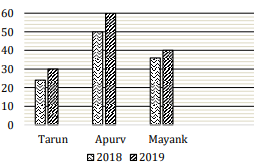
Question: What is the ratio of the total tax paid by Tarun and Mayank together in 2018 to the total tax paid by Apurv in 2018?