The bar graph given below shows the amount (in’000) of tax paid by three different people. Read the data carefully and answer the questions. Mayank pa...
Question
The bar graph given below shows the amount (in’000) of tax paid by three different people. Read the data carefully and answer the questions. 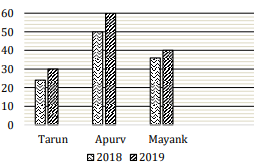
Mayank paid 1/4 of his income as tax in 2018, and his income increased by 25% in 2020 compared to 2018. The ratio of tax paid by Mayank in 2018 to that in 2020 is 9 : 10. If Mayank spends 1/6 and 25% of his remaining income on rent in 2018 and 2020 respectively, and saves the rest, find the difference between Mayank's savings in both years.