The pie chart below shows the percentage distribution of total students (Science + Commerce) in 12th class across five different zones. The table prov...
Question
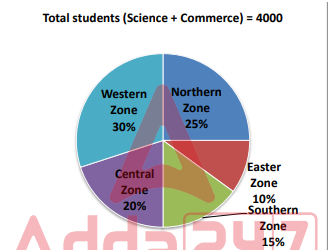
The pie chart below shows the percentage distribution of total students (Science + Commerce) in 12th class across five different zones. The table provides the number of students in the Science stream for each zone.
| Zone | Students in Science |
|---|---|
| Northern Zone | 400 |
| Eastern Zone | 310 |
| Southern Zone | 430 |
| Central Zone | 600 |
| Western Zone | 750 |
Total students (Science + Commerce) across all zones = 4000.
Percentage distribution of total students by zone:
Question:
The number of Commerce students in the Northern Zone is what percent more or less than the total number of students in the Southern Zone?