The pie chart below shows the percentage distribution of total students (Science + Commerce) in 12th class across five different zones. The table prov...
Question
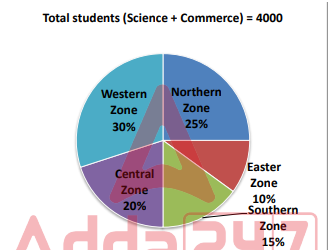
The pie chart below shows the percentage distribution of total students (Science + Commerce) in 12th class across five different zones. The table provides the number of students in the Science stream for each zone.
| Zone | Students in Science |
|---|---|
| Northern Zone | 400 |
| Eastern Zone | 310 |
| Southern Zone | 430 |
| Central Zone | 600 |
| Western Zone | 750 |
Total students (Science + Commerce) across all zones = 4000.
Percentage distribution of total students by zone:
If the monthly library fee per commerce student in the Central zone is Rs. 60, which is Rs. 20 less than the fee for science students, then find the total monthly library fee collected from the Central zone.