Directions: Read the following line graph carefully and answer the question below. The line graph shows one-third of the total items sold by five diff...
Question
Directions: Read the following line graph carefully and answer the question below. The line graph shows one-third of the total items sold by five different shops in two different years.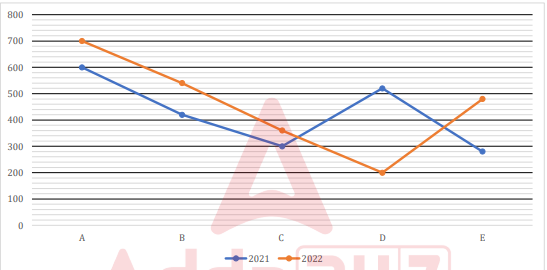
Note:
(i) Total number of items sold by each shop in 2023 is 20% more than that in 2021.
(ii) The numbers shown in the graph represent one-third of the total items sold by each shop in each year.
The line graph represents one-third of the total items sold by five different shops (A, B, C, D, E) in the years 2022 and 2023. Using the data from the graph, find the ratio of the total number of items sold by shop B in 2022 to the total number of items sold by shop C in 2023.