Direction: The Line graph shows the number of people (Boys + girls) visited five (A, B, C, D & E) different parks and the number of girls visited ...
Question
Direction: The Line graph shows the number of people (Boys + girls) visited five (A, B, C,
D & E) different parks and the number of girls visited out of total people visited these five parks.
Read the data carefully and answer the questions.
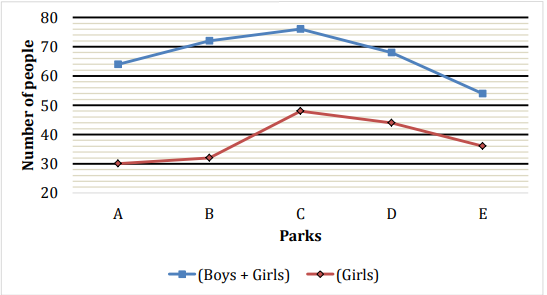
What percent of girls visited in park A with respect to the total number of people (Boys + Girls)
visited that park (approximately)?