The line graph below shows the number of students appeared from state A and state B in an examination over several years. What is the difference betwe...
Question
The line graph below shows the number of students appeared from state A and state B in an examination over several years.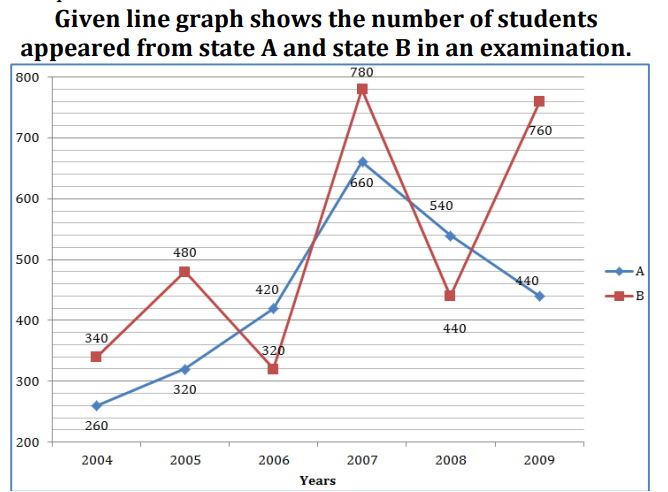
What is the difference between the total number of students from state A in 2004 and 2005 combined and the total number of students from state B in 2008 and 2009 combined?