The pie chart (i) given below shows percentage distribution of total people (male + female) visited five different clubs and pie chart (ii) shows perc...
Question
The pie chart (i) given below shows percentage distribution of total people (male + female) visited five different clubs and pie chart (ii) shows percentage distribution of total male visited in these five clubs. Read the data carefully and answer the questions given below.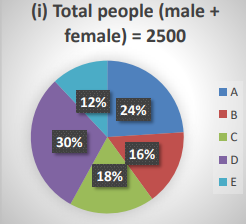
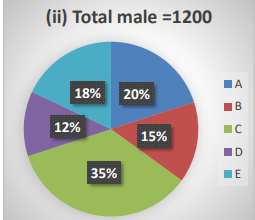
Q: The average number of females who visited clubs B, E, and X is 126. If the total males who visited club X are 45% of the total males who visited club A, then find the difference between the total number of people who visited club X and the total females who visited clubs A and C together.