The pie chart below shows the distribution (in degrees) of the total number of bookshelves manufactured by five companies P, Q, R, S, and T. The table...
Question
The pie chart below shows the distribution (in degrees) of the total number of bookshelves manufactured by five companies P, Q, R, S, and T. The table shows the percentage distribution of unsold bookshelves for each company:
| Company | Percentage of Unsold Bookshelves |
|---|---|
| P | 3X% |
| Q | 12% |
| R | 4X% |
| S | 20% |
| T | 40% |
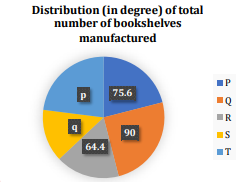
If the total unsold bookshelves are 500, find the total revenue generated by companies P and R from the sale of their bookshelves.