The pie chart below shows the distribution (in degrees) of the total number of bookshelves manufactured by five companies P, Q, R, S, and T. The table...
Question
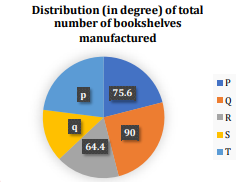
The pie chart below shows the distribution (in degrees) of the total number of bookshelves manufactured by five companies P, Q, R, S, and T. The table shows the percentage distribution of unsold bookshelves for each company.
| Company | Percentage of Unsold Bookshelves |
|---|---|
| P | 3X% |
| Q | 12% |
| R | 4X% |
| S | 20% |
| T | 40% |
Given that the difference between the total unsold bookshelves of P and R is 16, find the average number of sold bookshelves of Q, S, and T.