The pie chart below shows the distribution (in degrees) of the total number of bookshelves manufactured by five companies P, Q, R, S, and T. The table...
Question
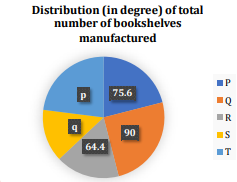
The pie chart below shows the distribution (in degrees) of the total number of bookshelves manufactured by five companies P, Q, R, S, and T. The table shows the percentage distribution of unsold bookshelves for each company.
| Company | Percentage of Unsold Bookshelves |
|---|---|
| P | 3X\% |
| Q | 12\% |
| R | 4X\% |
| S | 20\% |
| T | 40\% |
If the total unsold bookshelves of P and R together is 210, and the total sold bookshelves of X (where X is company P or R) is 15% less than that of Q, then find approximately by what percentage the total sold bookshelves of S are less than the total sold bookshelves of X.