The bar graph shows the number of students (in thousands) who opted for three different specializations—Quantitative Aptitude, English, and Reasoning—...
Question
The bar graph shows the number of students (in thousands) who opted for three different specializations—Quantitative Aptitude, English, and Reasoning—during the years 2015 to 2019 in a university.
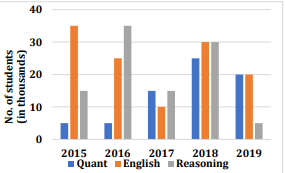
If the total number of students in the university in the year 2017 was $400,000$, what percentage of the total students opted for these three specializations combined in 2017?