The bar graph shows the number of students (in thousands) who opted for three different specializations—Quantitative Aptitude, English, and Reasoning—...
Question
The bar graph shows the number of students (in thousands) who opted for three different specializations—Quantitative Aptitude, English, and Reasoning—during the years 2015 to 2019 in a university.
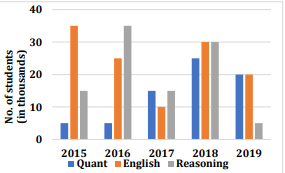
If the number of students who chose Reasoning in 2015 and 2018 together is approximately what percent of the total number of students who opted for all three subjects in the same years, find the approximate percentage.