The bar graph shows the number of students (in thousands) who chose three different specializations—Quant, English, and Reasoning—over five years at a...
Question
The bar graph shows the number of students (in thousands) who chose three different specializations—Quant, English, and Reasoning—over five years at a university.
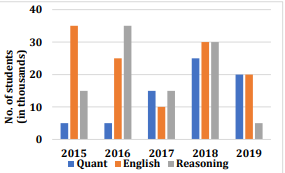
What is the respective ratio between the number of students who opted for English in the years 2016 and 2018 together to the number of students who opted for Quant in the years 2015 and 2019 together?