The bar graph given below shows percentage of people (male +female) not attended the seminar out ofthe total people in the city and percentage of male...
Question
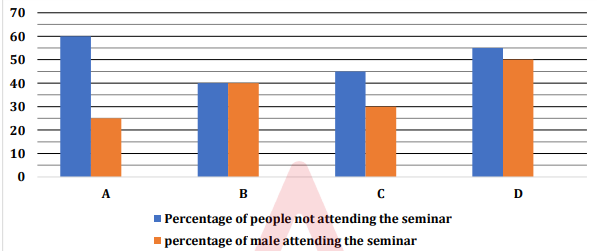
The bar graph given below shows percentage of people (male +female) not attended the seminar out ofthe total people in the city and percentage of male attended the seminar out of the total people attended the seminar from four different (A, B, C and D) cities. Read the graph carefully and answer the questions. Note: Total people in a city = People (male + female) attending the seminar + people (male + females) not attending the seminar. People attending/not attending the seminar = males + females
Given that the number of females who attended the seminar in city D is 2250, and the ratio of total females not attending the seminar to total males not attending the seminar in city D is 7 : 3, find the difference between the total females not attending and total males not attending the seminar in city D.