The bar graph shows the percentage of baked bricks out of total bricks in five brickfields (A, B, C, D, E) and the percentage of baked bricks sold by ...
Question
The bar graph shows the percentage of baked bricks out of total bricks in five brickfields (A, B, C, D, E) and the percentage of baked bricks sold by each brickfield. Given the following information:
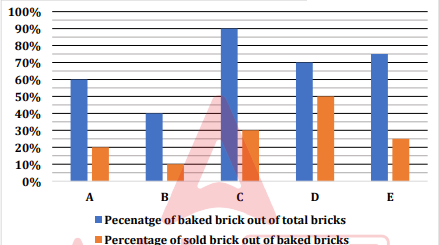
If the percentage of baked bricks out of total bricks in D is 60% and the percentage of sold baked bricks in D is 70%, find the number of unsold baked bricks in brickfield D.