The bar graph shows the percentage of baked bricks out of total bricks and the percentage of baked bricks sold by five brickfields A, B, C, D, and E. ...
Question
The bar graph shows the percentage of baked bricks out of total bricks and the percentage of baked bricks sold by five brickfields A, B, C, D, and E.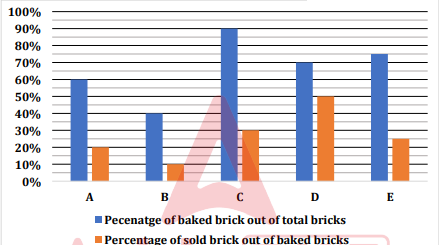
If the total number of bricks in brickfield A is 50% more than the number of unbaked bricks in brickfield D, then find the number of sold baked bricks by brickfield A.