Line graph shows percentage distribution of orders delivered in week II and percentage of orders returns on the following days. Read the data carefull...
Question
Line graph shows percentage distribution of orders delivered in week II and percentage of orders returns on the following days. Read the data carefully and answer the questions. Note –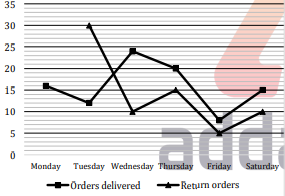
(i) Total order received on Sunday of Week II it will be delivered on next six days of week (Monday, Tuesday, Wednesday, Thursday, Friday & Saturday). (ii) Remaining orders which did not delivered in these six days of week II are 25. (iii) orders which received did not return on same day it has to be return next day of delivery. No orders are return on Sunday of week III
If the number of orders delivered on Friday and Thursday are interchanged, what is the difference between the number of orders returned on Friday and Saturday now?