Study the following information carefully and answer the given questions. Given graph shows population density (in per Sq Km) and Land area (in sq km)...
Question
Study the following information carefully and answer the given questions.
Given graph shows population density (in per Sq Km) and Land area (in sq km) of four different Villages A, B, C
and D in the year 2001 are given.
(1) Population density = Total population of the village
land area
(2) Gender Ratio = Total number of males in a village
Total number of female in a village
× 100
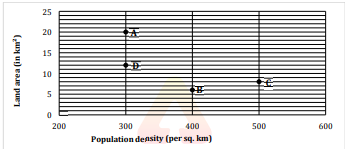
In 2001, the ratio of the total population of village B to that of village E is 1 : 4. If the population density of village E increases by 50% in 2010, what is the population of village E in 2010?