Study the chart given below carefully and answer the following questions. OHLC (Open-High-Low-Close) chart given below shows data regarding trading in...
Question
Study the chart given below carefully and answer the following questions.
OHLC (Open-High-Low-Close) chart given below shows data regarding trading in stock of company – X on 5 different days.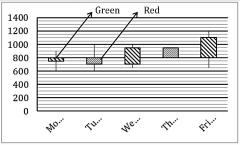
[NOTE: 1. Red Candle – Top end & bottom end represents opening & closing value of the share respectively of a particular day. 2. Green Candle – Top end & bottom end represents closing & opening value of the share respectively of a particular day.
3. Vertical line represents highest & lowest value of the share of a particular day.]
If an individual sells an equal amount of share on Monday at lowest price, Tuesday at closing price, Wednesday at highest price, Thursday at lowest price and Friday at highest price then on which day the profit obtained was maximum? (On each day shares were purchased at opening price of that day)