Study the chart given below carefully and answer the following questions. OHLC (Open-High-Low-Close) chart given below shows data regarding trading in...
Question
Study the chart given below carefully and answer the following questions.
OHLC (Open-High-Low-Close) chart given below shows data regarding trading in stock of company – X on 5 different days.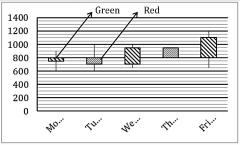
[NOTE: 1. Red Candle – Top end & bottom end represents opening & closing value of the share respectively of a particular day. 2. Green Candle – Top end & bottom end represents closing & opening value of the share respectively of a particular day.
3. Vertical line represents highest & lowest value of the share of a particular day.]
On which day the difference between the opening value of each unit of share and the lowest value of each unit of share for that day is the lowest?