Bar graph shows the number of fans produced (in hundreds) by a manufacturer in the period of four months i.e. from January to April. Shopkeeper has to...
Question
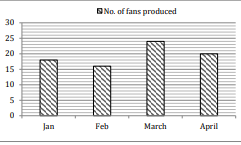
Bar graph shows the number of fans produced (in hundreds) by a manufacturer in
the period of four months i.e. from January to April.
Shopkeeper has to decide whether to test or not all the units of fans before sending them to the customer.
If he has decided to test he has two options.
(a) Option I
(b) Option II
Option I:- It cost Rs 2.50 per unit as testing cost but this method of testing allows 30% of defective fans
to pass to the customer.
Option II:- It cost Rs 4 per unit as testing cost and it find 90% of defective units
→ All defective units identified at the customer end, will causes a penalty of Rs 60 per units. Which are to
be paid by shopkeeper. Defective units found during testing are repaired at Rs 20 per unit.
Find ratio of all defective units of January to April months if in January he uses option I for testing
and in April, option II as testing. Repairing cost of April is Rs 5300 more than that of January where as
penalties for January is Rs 900 more than that of April