The given bar graph shows the percentage of query resolved by three people Abhi, Bindu and Chintu on Monday and Friday with respect to total calls rec...
Question
The given bar graph shows the percentage of query resolved by three people Abhi, Bindu and Chintu on Monday and Friday with respect to total calls received by them.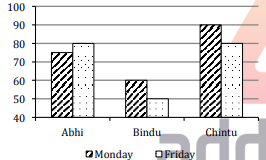
No. of query resolved by Abhi and Chintu on Friday is 360. What could be maximum number of calls that were not resolved by Abhi on Friday?