Study the given bar graph carefully which shows Rahul's expenditure in different categories over the years 2011 to 2014. What is the percentage of...
Question
Study the given bar graph carefully which shows Rahul's expenditure in different categories over the years 2011 to 2014.
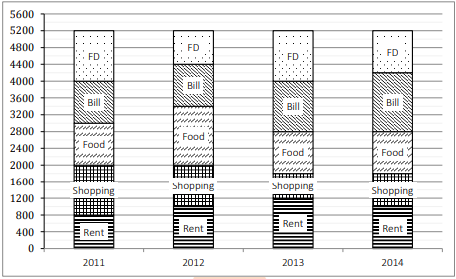
What is the percentage of the average amount paid by Rahul on FD, Rent, and Food in the year 2012 with respect to the average amount paid by him on Shopping, Rent, and Bill in the year 2013?