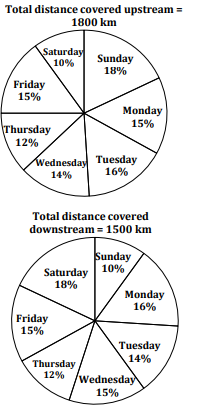
The pie charts represent the distances covered by a boat moving upstream and downstream over seven days of a week. The total distance covered upstream...
Question
The pie charts represent the distances covered by a boat moving upstream and downstream over seven days of a week. The total distance covered upstream is and downstream is . The percentages of distances covered each day are as follows:
The table below shows the speed of the stream (in km/hr) on different days:
| Day | Speed of Stream (km/hr) |
|---|---|
| Monday | 2 |
| Tuesday | 3 |
| Wednesday | - |
| Thursday | 1 |
| Friday | 2 |
| Saturday | - |
| Sunday | 4 |
The speed of the boat in still water on Saturday was . On Sunday, the speed of the boat in still water was less than that on Saturday. If the time taken by the boat to travel upstream on Saturday is times the time taken to travel downstream on Sunday, then find the time taken by the boat to cover a distance of upstream when the speed of the stream is the same as that on Saturday.