A, B, C, D and E are five persons employed to complete a job X. Line graph shows the data regarding the time taken by these five persons to complete t...
Question
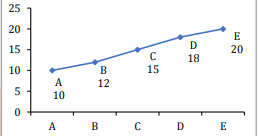
A, B, C, D and E are five persons
employed to complete a job X. Line graph shows the data
regarding the time taken by these five persons to complete
the job X individually. Table shows the actual time for
which every one of them worked on the job X.
| Person | Days Worked |
|---|---|
| A | 2 |
| B | ? |
| C | 3 |
| D | ? |
| E | 2 |
Note 1: All persons worked for whole number of days.
Note 2: Jobs Y and Z are similar to job X and require the same amount of effort as job X.
If A, C, and E worked on job Z for 2 days each, and the remaining work was completed by B and D, and the ratio of the number of days B and D worked is 20 : 21, then find the number of days B worked.