In a state, tourists are categorized into Domestic and International. The pie chart below shows the percentage distribution of these tourists over thr...
Question
In a state, tourists are categorized into Domestic and International. The pie chart below shows the percentage distribution of these tourists over three quarters of a year.
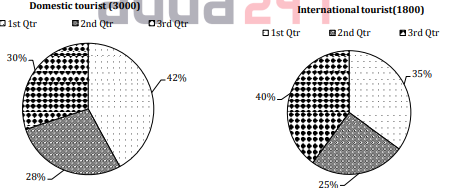
If the 4th quarter is included, the number of domestic tourists in the 3rd quarter becomes 25% of the total domestic tourists for the entire year. What is the number of domestic tourists in the 4th quarter?