In a state, tourists are categorized into Domestic and International. The pie chart below shows the percentage distribution of these tourists over thr...
Question
In a state, tourists are categorized into Domestic and International. The pie chart below shows the percentage distribution of these tourists over three quarters of a year.
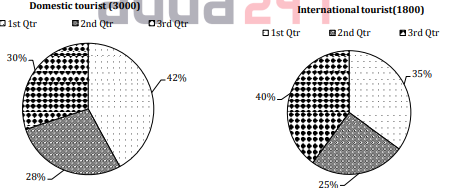
What is the approximate percentage of the total number of domestic tourists who visited in the 2nd and 3rd quarters combined with respect to the total number of international tourists in the 2nd and 3rd quarters combined?