The following bar graph shows the percentage breakup of a person's salary from the year 2001 to 2005 in terms of Transport Expenses, EMI Expenses,...
Question
The following bar graph shows the percentage breakup of a person's salary from the year 2001 to 2005 in terms of Transport Expenses, EMI Expenses, and Savings. 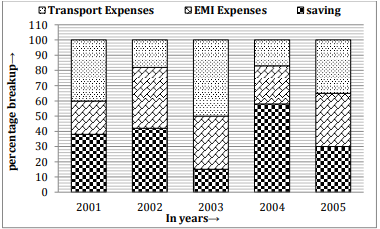 . If the saving in 2002 is 3/5 of the saving in 2004, and the total salary in 2004 is Rs. 1,75,000, what is the total expenditure spent on transport in 2002? (Note: The percentage of saving in 2004 is 58% and the percentage of transport expenditure in 2002 is 18%.)