The following bar graph shows the percentage breakup of a person's salary from the year 2001 to 2005 in terms of Transport Expenses, EMI Expenses,...
Question
The following bar graph shows the percentage breakup of a person's salary from the year 2001 to 2005 in terms of Transport Expenses, EMI Expenses, and Savings.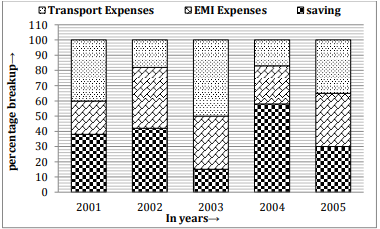
If the monthly salary doubles every year compared to the previous year, what is the ratio of the monthly salary in 2005 to the transport expenses in 2003?