The pie chart below shows the percentage distribution of total students and total boys in five different schools (A, B, C, D, and E) in the year 2019....
Question
The pie chart below shows the percentage distribution of total students and total boys in five different schools (A, B, C, D, and E) in the year 2019.
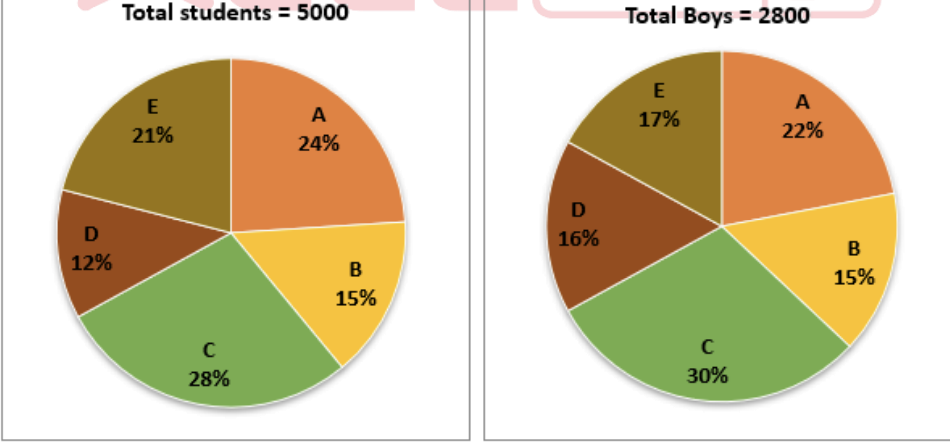
What is the percentage of total girls from schools B and D combined with respect to the total students from schools C and D combined?