The pie charts below show the percentage distribution of total students and total boys in five different schools (A, B, C, D, and E) in the year 2019....
Question
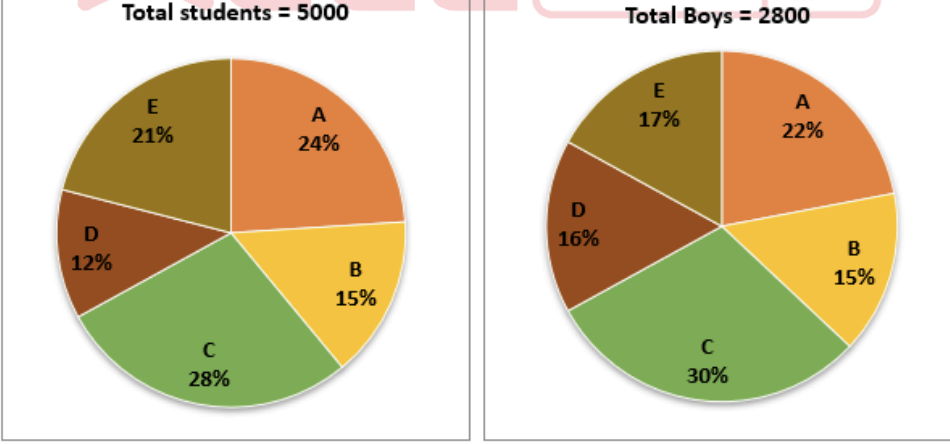
The pie charts below show the percentage distribution of total students and total boys in five different schools (A, B, C, D, and E) in the year 2019. The total number of students across all schools is 5000, and the total number of boys is 2800.
In 2020, the number of girls in school B increased by 20% compared to 2019, while the number of boys in school B decreased by over the previous year.
What is the percentage difference between the total students in school B in 2020 and the total students in school D in 2019? Is it more or less, and by how much?