Study the pie chart given below and answer the following questions. Pie charts shows the percentage distribution of total students in five different s...
Question
Study the pie chart given below and answer the following questions.
Pie charts shows the percentage distribution of total students in five different schools (A, B, C, D
and E) and percentage distribution of total boys in these five schools in year 2019.
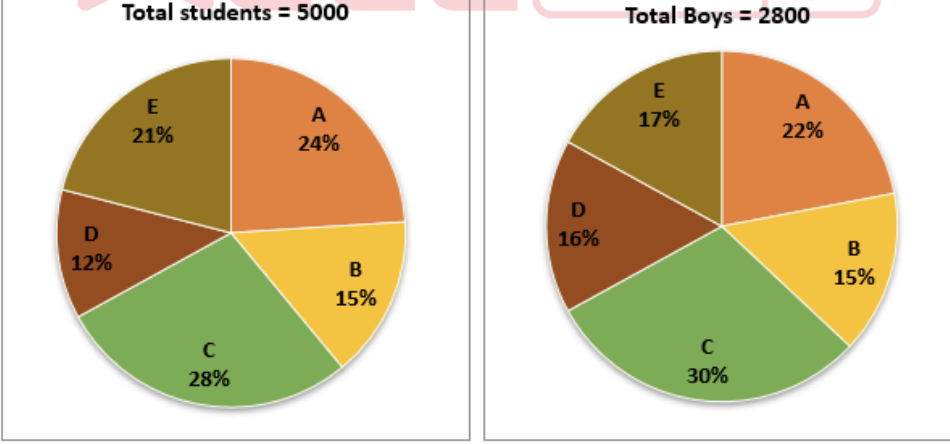 Out of the total boys in school A, failed the exam. If of the total students in school A failed the exam, then what is the percentage of girls in school A who failed the exam with respect to the total girls in school C?