The pie charts below represent the percentage distribution of total students and total boys across five schools (A, B, C, D, and E) in the year 2019. ...
Question
The pie charts below represent the percentage distribution of total students and total boys across five schools (A, B, C, D, and E) in the year 2019. The total number of students is 5000, and the total number of boys is 2800.
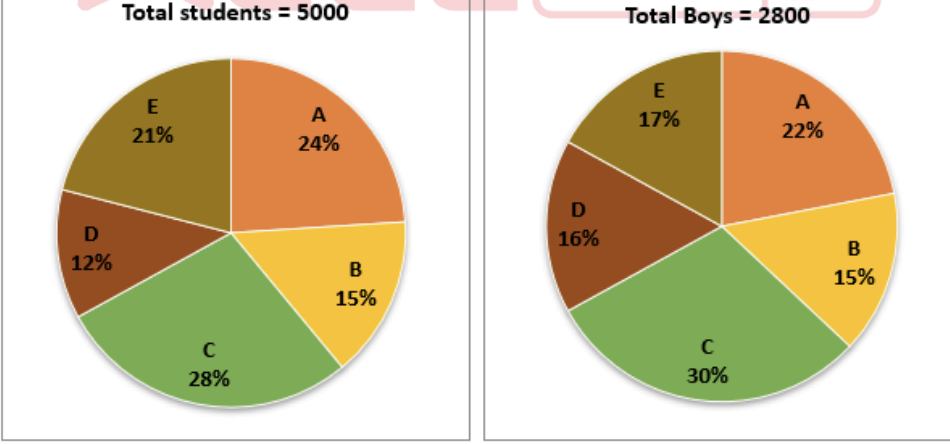
Find the difference between the number of girls and boys in the school where the number of girls is the highest.