Study the pie chart given below and answer the following questions. Pie charts shows the percentage distribution of total students in five different s...
Question
Study the pie chart given below and answer the following questions.
Pie charts shows the percentage distribution of total students in five different schools (A, B, C, D
and E) and percentage distribution of total boys in these five schools in year 2019.
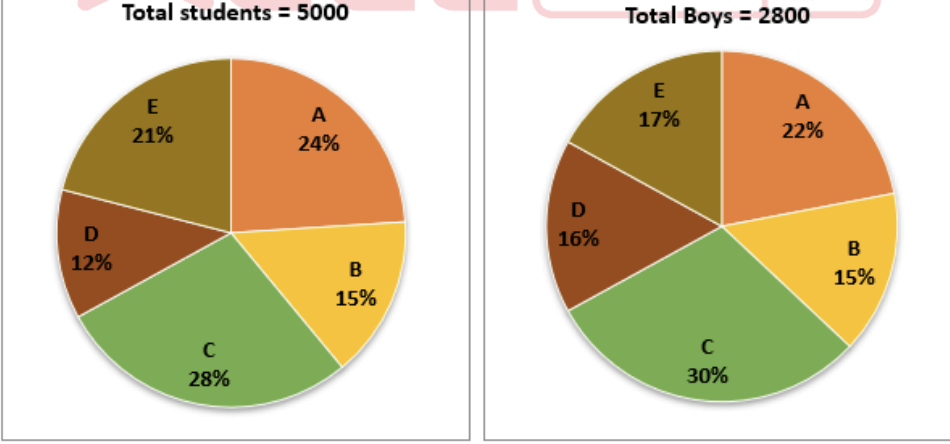
What is the average number of boys in schools C, D, and E?