The bar graph shows the percentage distribution of the number of challans generated in five different cities (A, B, C, D, and E) during two months: Ju...
Question
The bar graph shows the percentage distribution of the number of challans generated in five different cities (A, B, C, D, and E) during two months: June and July. The total number of challans generated in June is 800, and in July is 1200.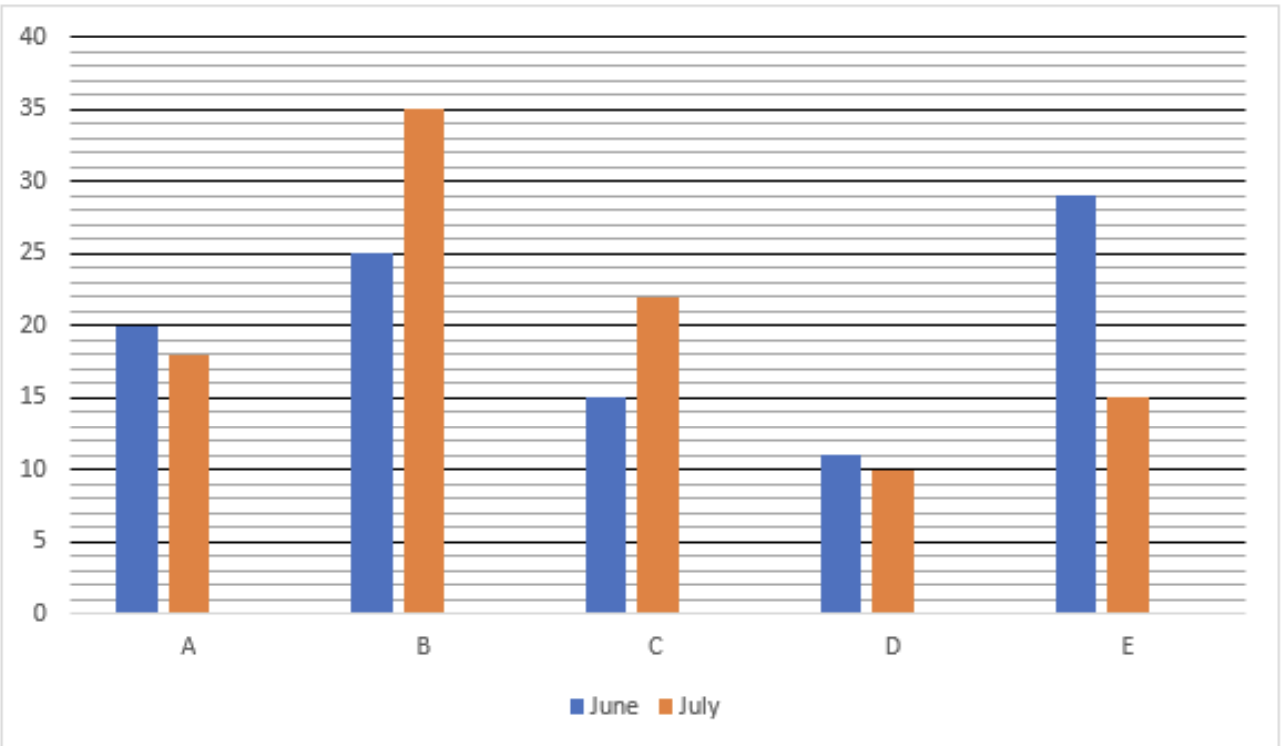
What is the difference between the total number of challans generated in cities A and B together in July and the total number of challans generated in cities D and E together in June?