The bar graph shows the percentage distribution of the number of challans generated in five different cities (A, B, C, D, and E) during two months: Ju...
Question
The bar graph shows the percentage distribution of the number of challans generated in five different cities (A, B, C, D, and E) during two months: June and July. The total number of challans generated in June is 800 and in July is 1200.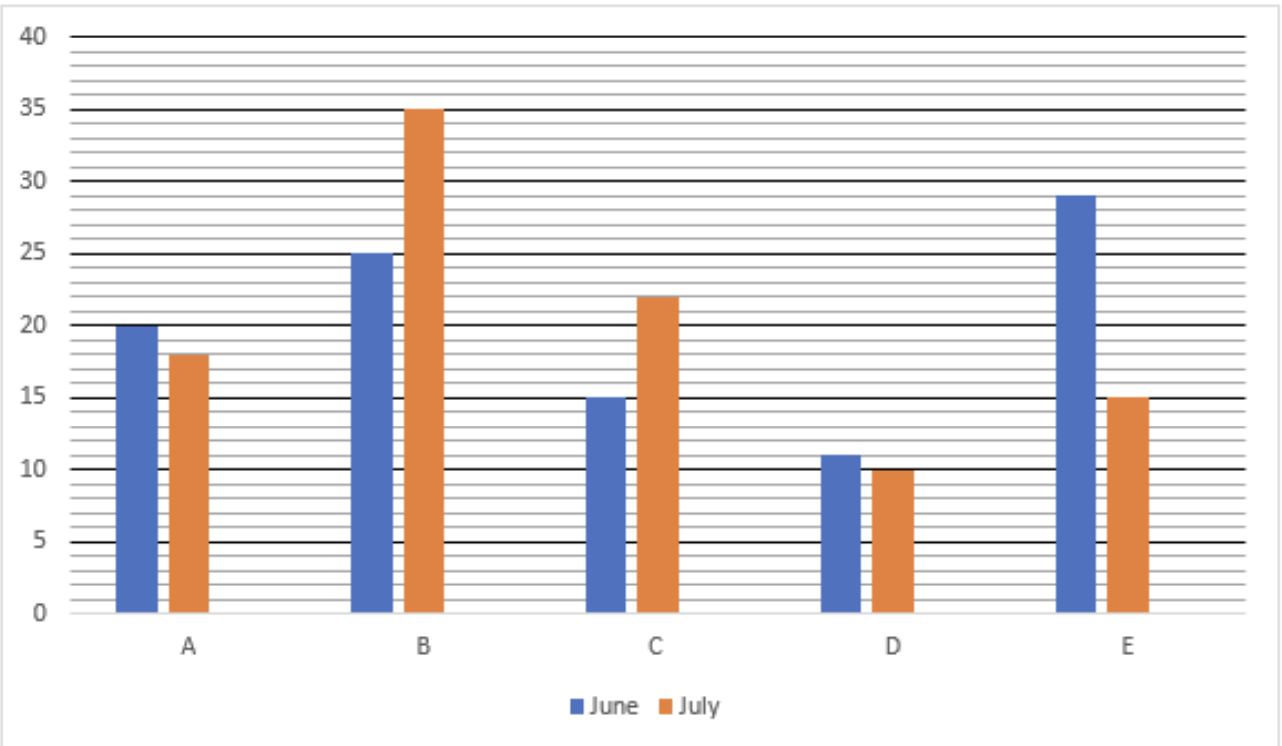
If 55% of the total number of challans generated in city B over both months are paid offline, find the number of challans paid online in city B during these two months combined.