The pie charts below show the percentage distribution of total students selected in the SSC examination and the percentage distribution of total boys ...
Question
The pie charts below show the percentage distribution of total students selected in the SSC examination and the percentage distribution of total boys selected from six different zones.
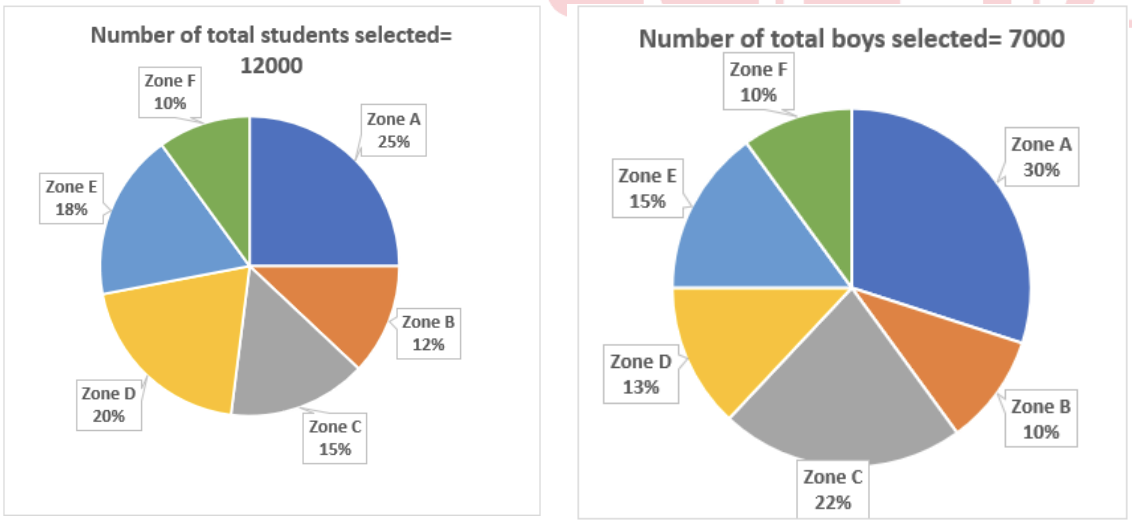
What percentage of the total number of students selected from zones A, C, and F together is the total number of boys selected from zones A and F together?