The pie charts below represent the percentage distribution of total students selected in the SSC examination and the percentage distribution of boys s...
Question
The pie charts below represent the percentage distribution of total students selected in the SSC examination and the percentage distribution of boys selected from six different zones. The total number of students selected is $12000$, and the total number of boys selected is $7000$.
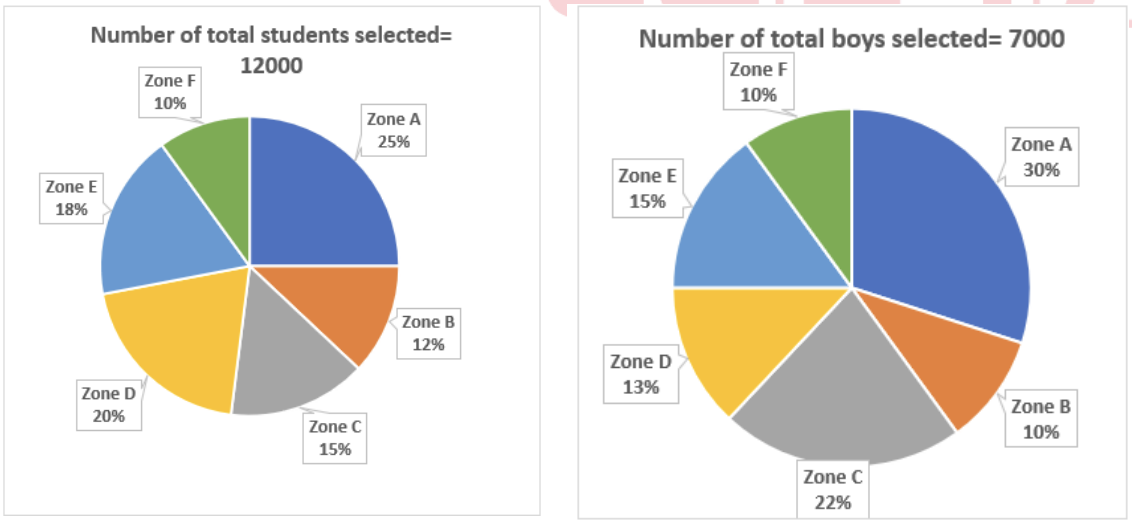
What is the ratio of the average number of boys selected to the average number of girls selected from all six zones?