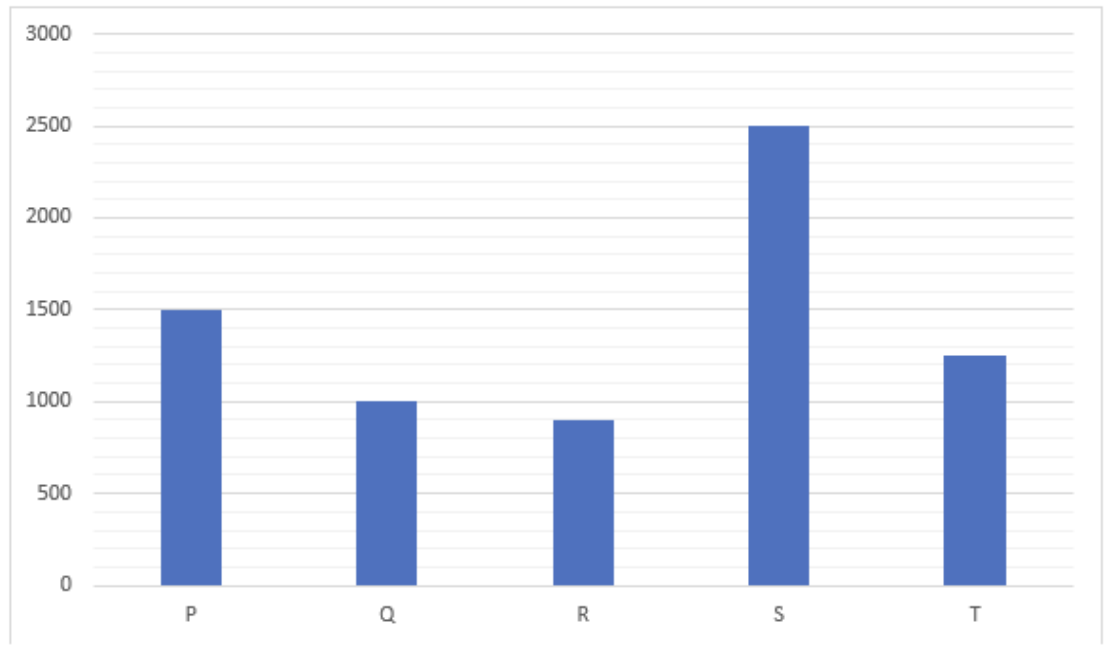
In the given bar graph, the number of shirts and pants manufactured by companies S and T in a month are shown. The total number of shirts and pants ma...
Question
In the given bar graph, the number of shirts and pants manufactured by companies S and T in a month are shown. The total number of shirts and pants manufactured by company S is what percent more or less compared to company T?