In the given bar graph, the number of shirts and pants produced by a company in a month is shown for five companies P, Q, R, S, and T. For company R, ...
Question
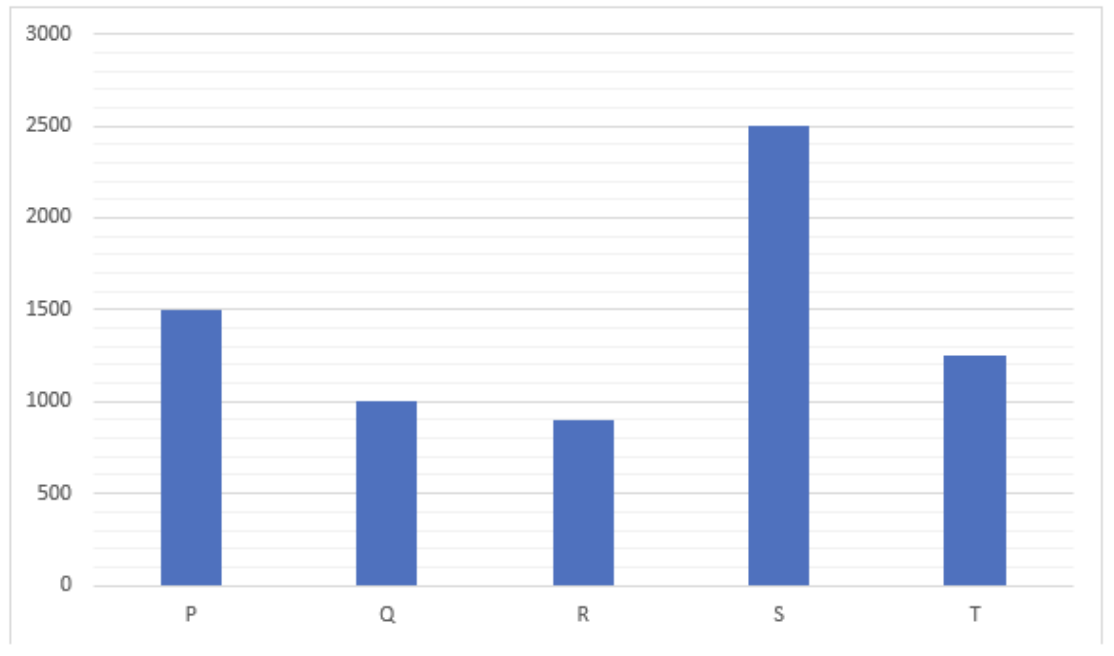
In the given bar graph, the number of shirts and pants produced by a company in a month is shown for five companies P, Q, R, S, and T. For company R, the ratio of shirts to pants manufactured is 1:2. What is the ratio of the number of shirts manufactured by company R to the total number of shirts and pants manufactured by company T?