The bar graph below shows the number of shirts and pants manufactured by five different companies (P, Q, R, S, and T) in a month: What is the average ...
Question
The bar graph below shows the number of shirts and pants manufactured by five different companies (P, Q, R, S, and T) in a month: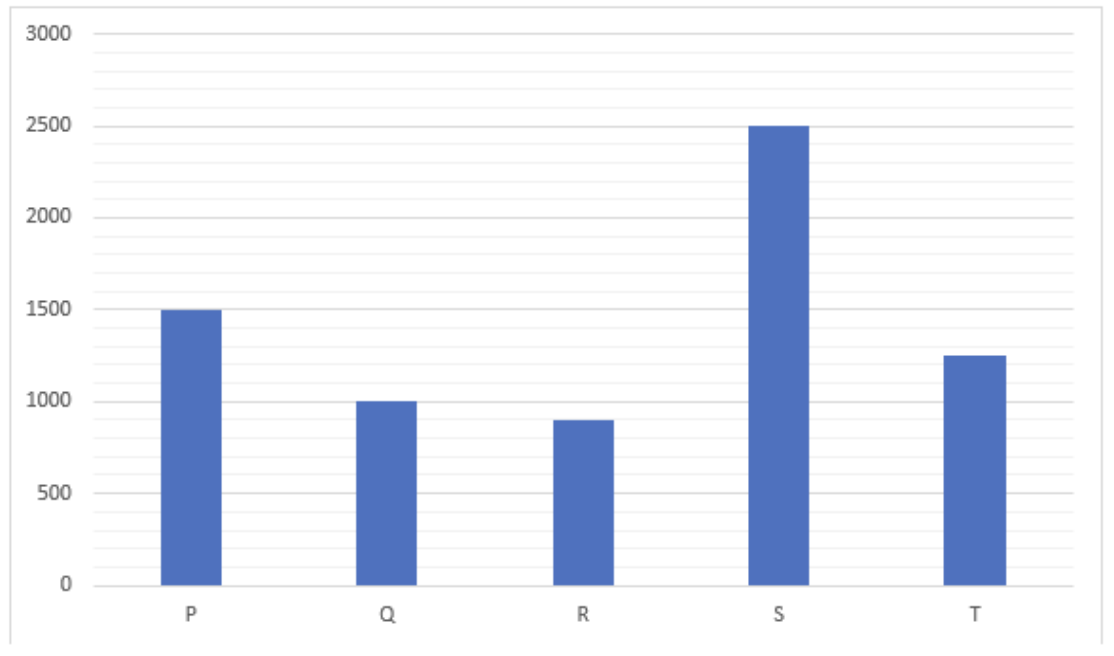
What is the average number of shirts and pants manufactured by all the companies combined?