The bar graph shows the number of shirts and pants produced by five companies P, Q, R, S, and T in a month. The approximate total production values ar...
Question
The bar graph shows the number of shirts and pants produced by five companies P, Q, R, S, and T in a month. The approximate total production values are:
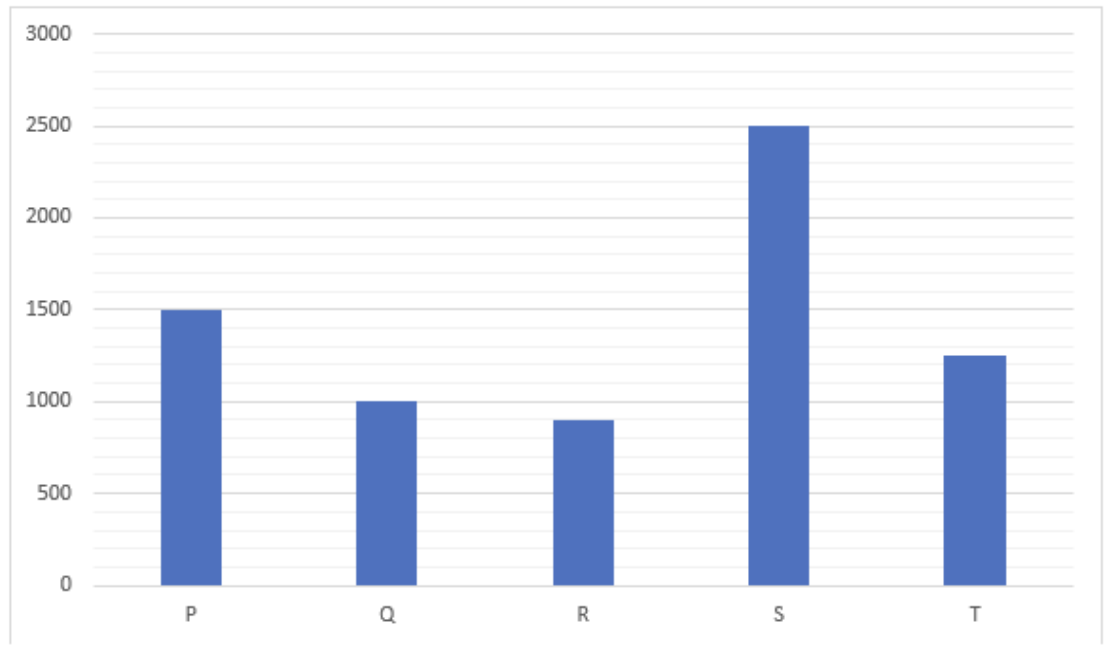
For companies P, R, and T, the ratio of shirts to pants is given as 3:7, 4:5, and 3:2 respectively. Calculate the combined total number of shirts and the combined total number of pants produced by these three companies.