The pie chart represents the total number of goods (both sold and unsold) produced by four companies A, B, C, and D. The total goods manufactured by a...
Question
The pie chart represents the total number of goods (both sold and unsold) produced by four companies A, B, C, and D. The total goods manufactured by all companies combined is 200 units. The distribution is as follows: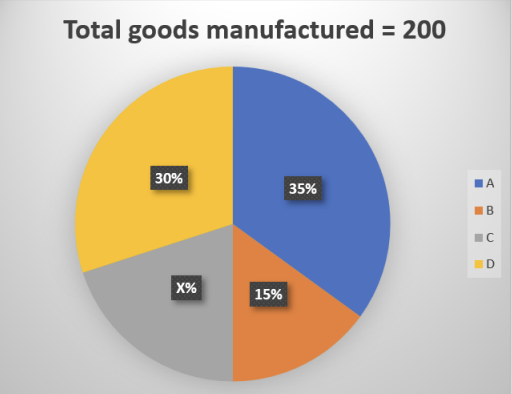
- Company A: 30%
- Company B: 35%
- Company C: 15%
- Company D: Remaining percentage
The table below shows the percentage of goods sold by each company out of their total production:
| Company | Percentage of Goods Sold |
|---|---|
| A | 90% |
| B | 80% |
| C | 75% |
| D | 4X% |
Find the difference between the average number of goods sold by companies B and C and the number of unsold goods of company D.