The pie chart below represents the percentage distribution of marks obtained in Mathematics out of the total marks secured by five students (A, B, C, ...
Question
The pie chart below represents the percentage distribution of marks obtained in Mathematics out of the total marks secured by five students (A, B, C, D, and E) in the class. The class has only three subjects: Hindi, English, and Mathematics.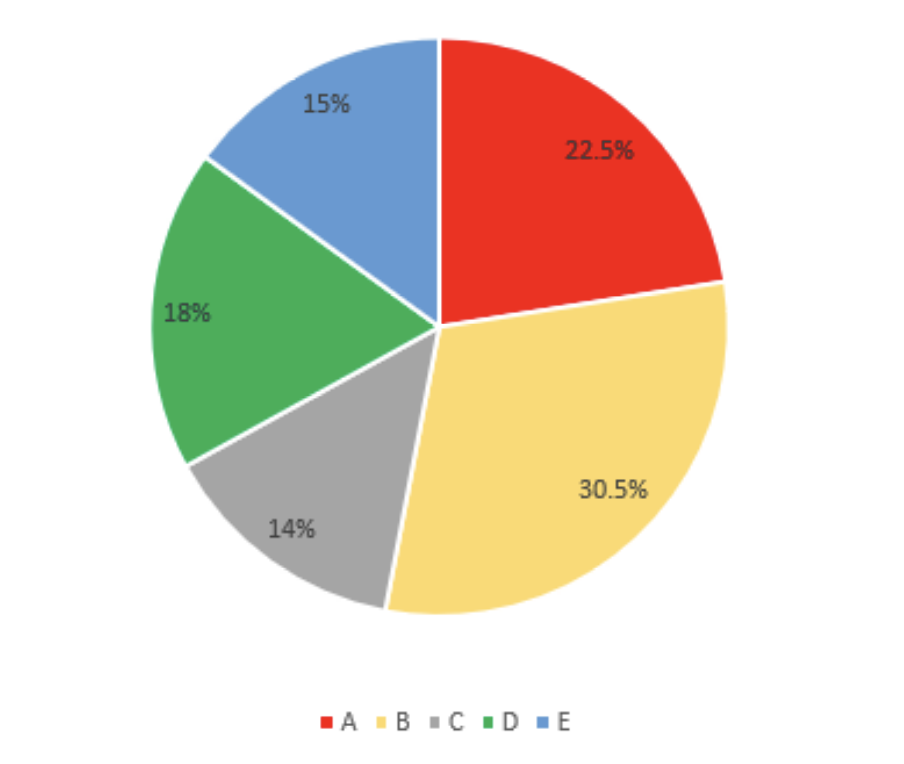
What is the ratio of marks obtained by student A to the combined marks of students D and C in Mathematics out of the total marks obtained by all five students in Mathematics?