The pie chart below represents the percentage distribution of marks obtained in Mathematics by five students (A, B, C, D, and E) out of the total mark...
Question
The pie chart below represents the percentage distribution of marks obtained in Mathematics by five students (A, B, C, D, and E) out of the total marks obtained by all five students combined in Math. The total marks obtained by all five students in Math is 600.
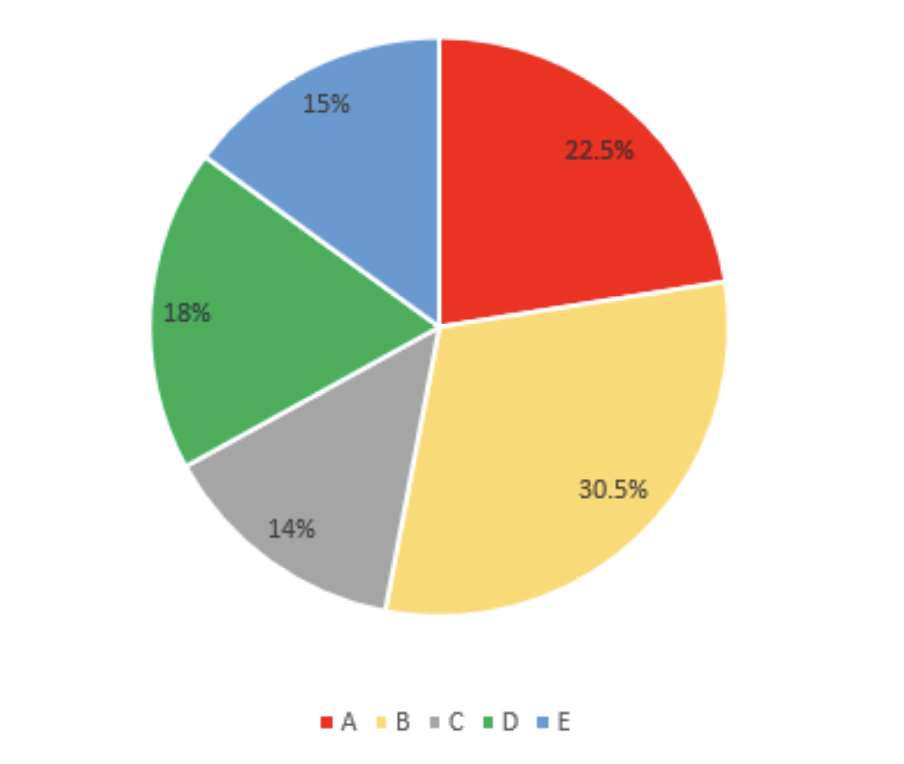
What is the difference between the marks obtained by student B and student A in Math?