The pie chart shows the income distribution of four earning members of a family as a percentage of the total family income in the year 2016: If A and ...
Question
The pie chart shows the income distribution of four earning members of a family as a percentage of the total family income in the year 2016:
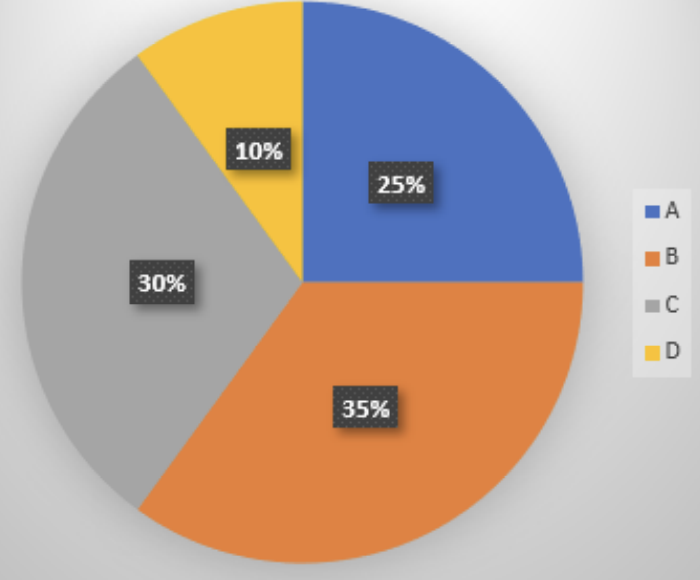
If A and C spend 80% and 60% of their income respectively, and the total savings of both A and C together is Rs. 40,800, what is the income of C?